Exercise
Practice creating a web map in QGIS
Table of contents
Overview
There are lots of ways to make a web map. This exercise uses a relatively easy method by taking advantage of the qgis2web plugin that was designed for the open-source software, QGIS. This exercise is not a complete step-by-step tutorial. You can watch the workshop recording if you would like to follow along with the demo.
Resources to check out
- Ujaval Gandhi’s Web Mapping with QGIS2Web (QGIS3) is an excellent step-by-step tutorial that you can follow along using the data from this workshop.
- Tom Chadwin’s qgis2web GitHub repo, where you can find more information and details about the qgis2web plugin.
- The suite of tutorials about Leaflet - particularly helpful if you choose the Leaflet export option in qgis2web and want to level-up by adding your own customizations to the code.
Design a map
Step 1: Get the Data
The first step is to figure out what data you want to include in the map.
For the demo, I’m using a single point layer that has a mix of categorical and quantitative data. Feel free to use your own data, or follow along by downloading the data pack I’m using.
This link will take you to a page on GitHub. Click the download button to save it to your computer.
Step 2: Make the Data Look Nice
Once you’ve got data, use QGIS to design a map that you want to share with the world online. Some things to think about:
- Colors - make sure they’re accessible and look good on a screen (try Color Brewer 2.0!)
- Fonts - ditto
- Field names - if fields will appear anywhere in your map (e.g. pop-ups), give them a human-readable “alias” in
Layer Properties > Attribute Form - Overall design - think about how someone will interact with your web map; aim for simple and easy to interpret
Check out the State of Minnesota’s guides for Interactive Web Maps for help ensuring your web map is accessible.
Create the web map files
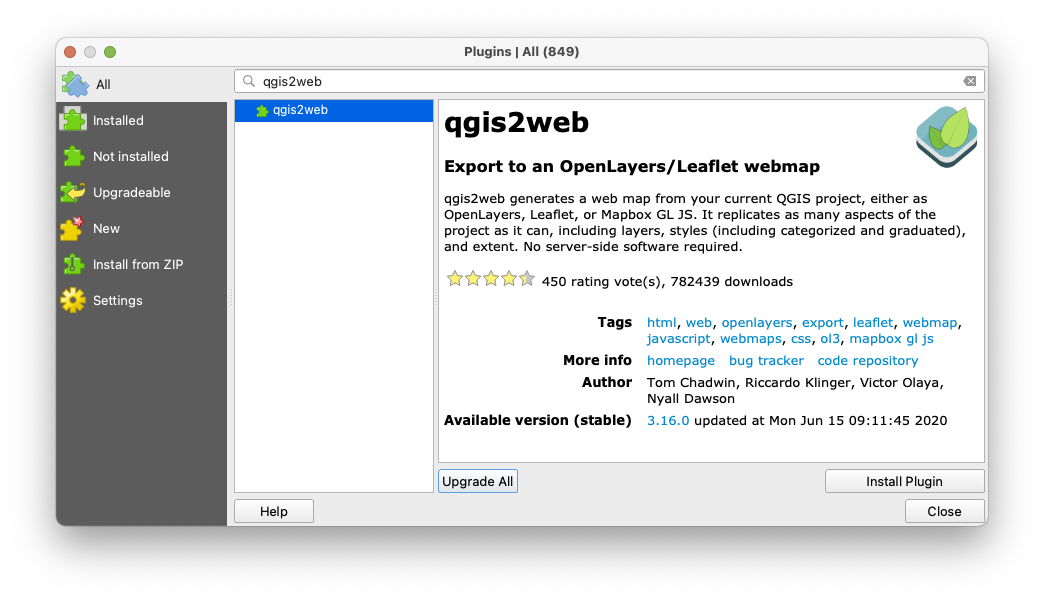
Step 3: Install the qgis2web plugin
See Installing Helpful Plugins for instructions if you need a refresher on how to install plugins.

Step 4: Use the qgis2web plugin
For a step-by-step tutorial, see Ujaval Gandhi’s Web Mapping with QGIS2Web (QGIS3).
No, seriously. That tutorial is awesome, and has lots of screenshots to help you configure the plugin correctly in order to export (and test out) the web map pack.
Upload the files to GitHub
The rest of the steps in this exercise will guide you through how to upload the files to a GitHub repository and publish the web map with GitHub Pages.
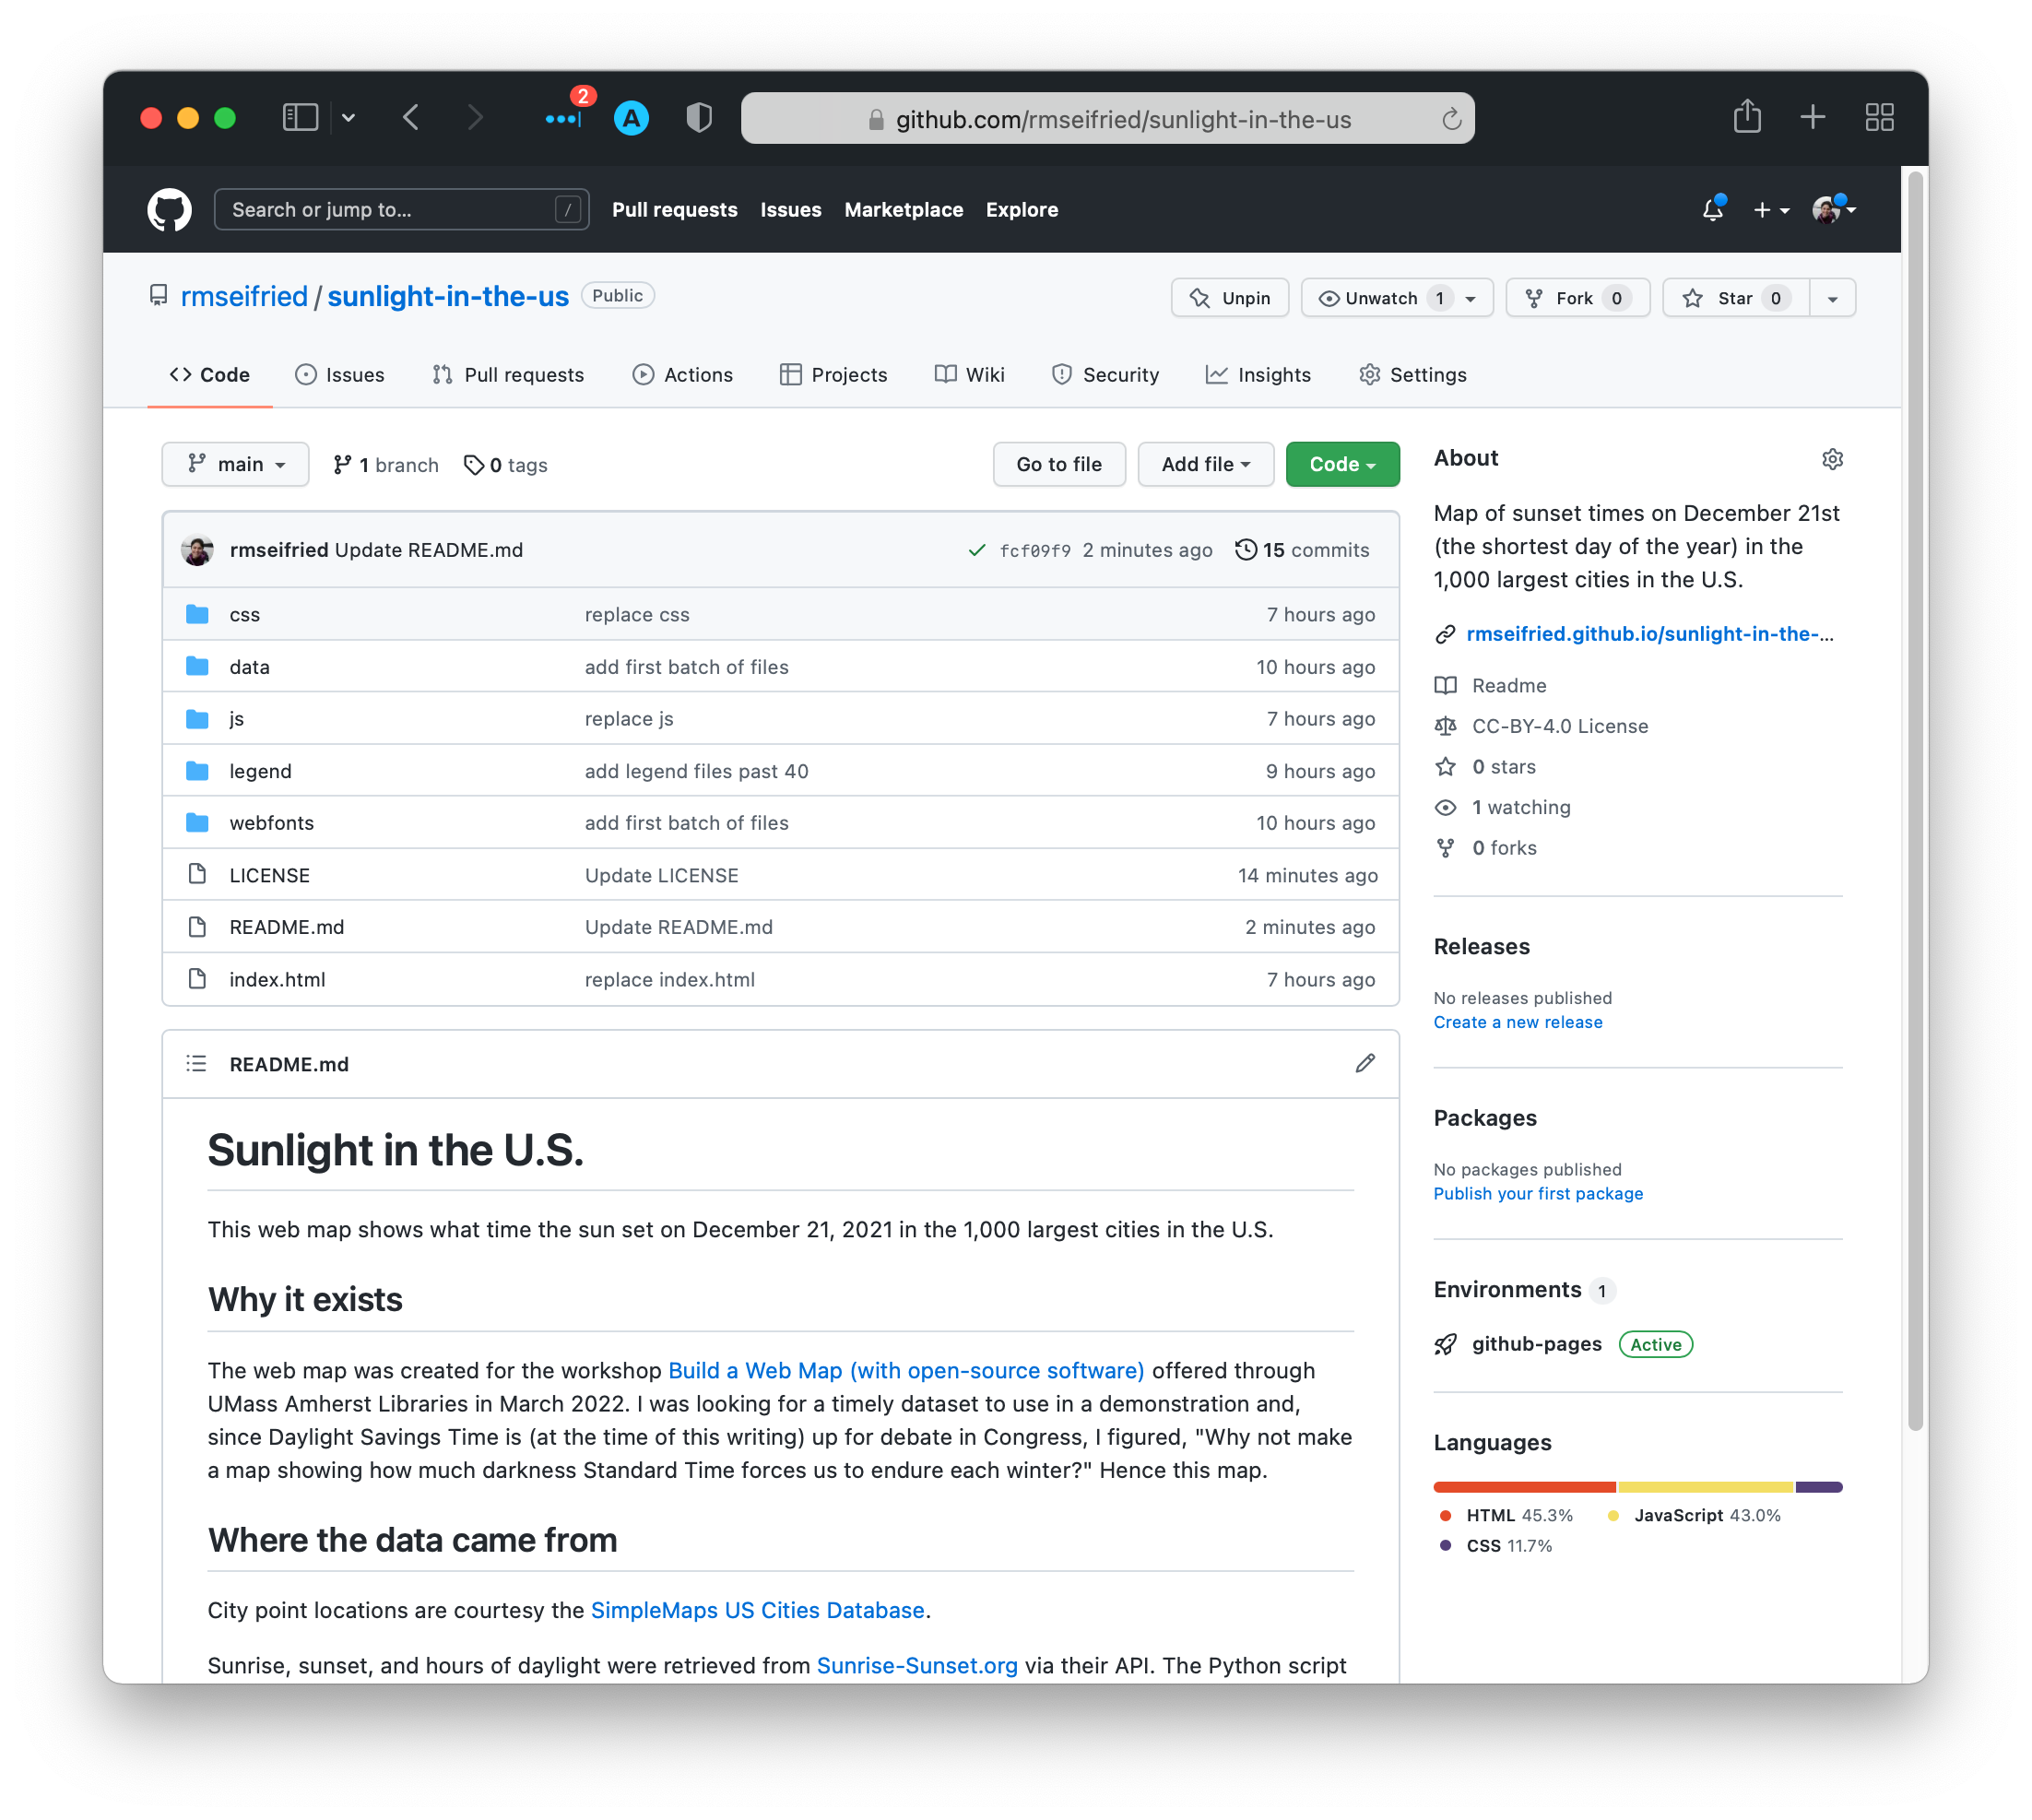
Check out the demo repository before getting started
Step 5: Sign in to GitHub
Or create a new account if you don’t have one yet.
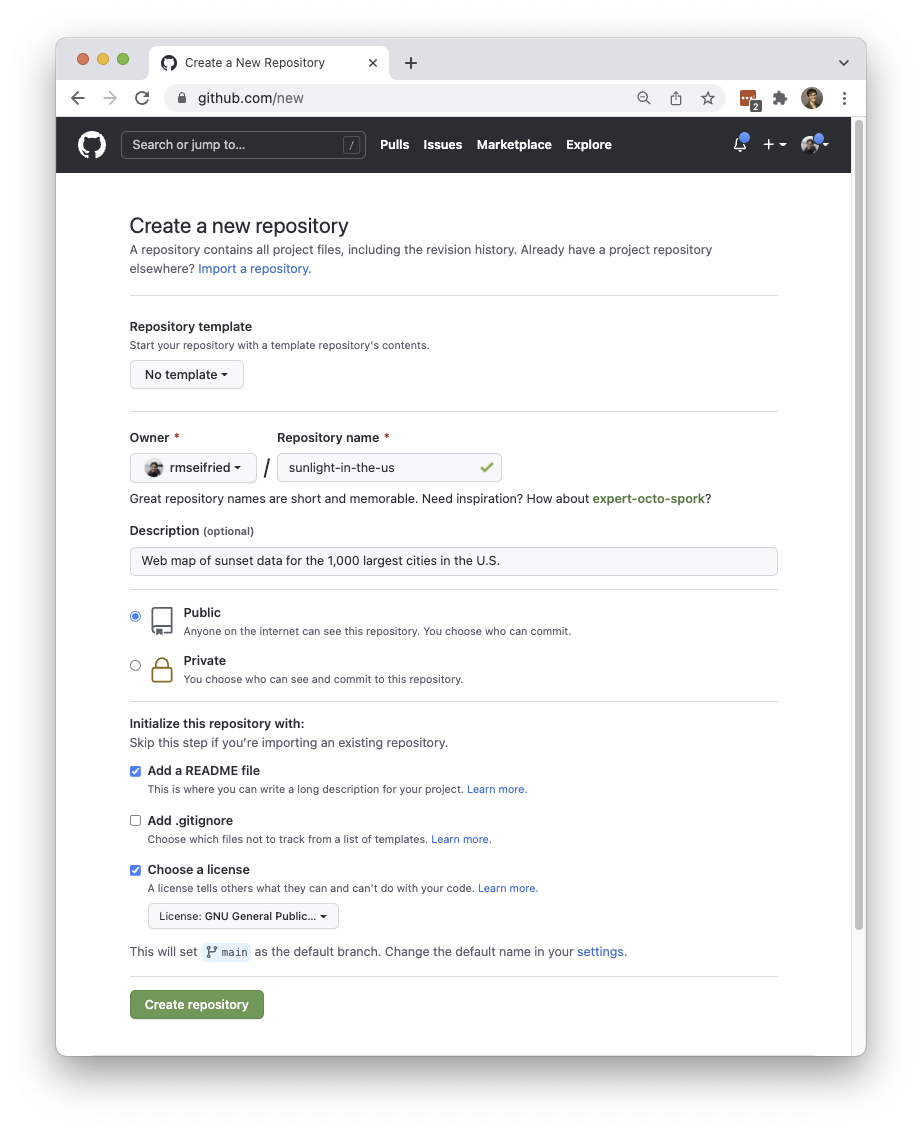
Step 6: Create a new repository
Click the green New button to create a new repository that will host the web map files. Give it a name and description, and configure the rest of the settings.

Once the repo is created and you see the main overview page, click Add file > Upload files. Drag-and-drop or upload the files that the qgis2web plugin created (making sure to preserve the folder structure), add a short note in the “Commit Changes” box, then click Commit Changes.
If you hit a file upload limit, you might need to upload the files in a couple of batches.
Make sure to fill out the ReadMe.md file so that people who visit your repo will know what it’s about, who made it and why, and where the data came from.

Publish the web map
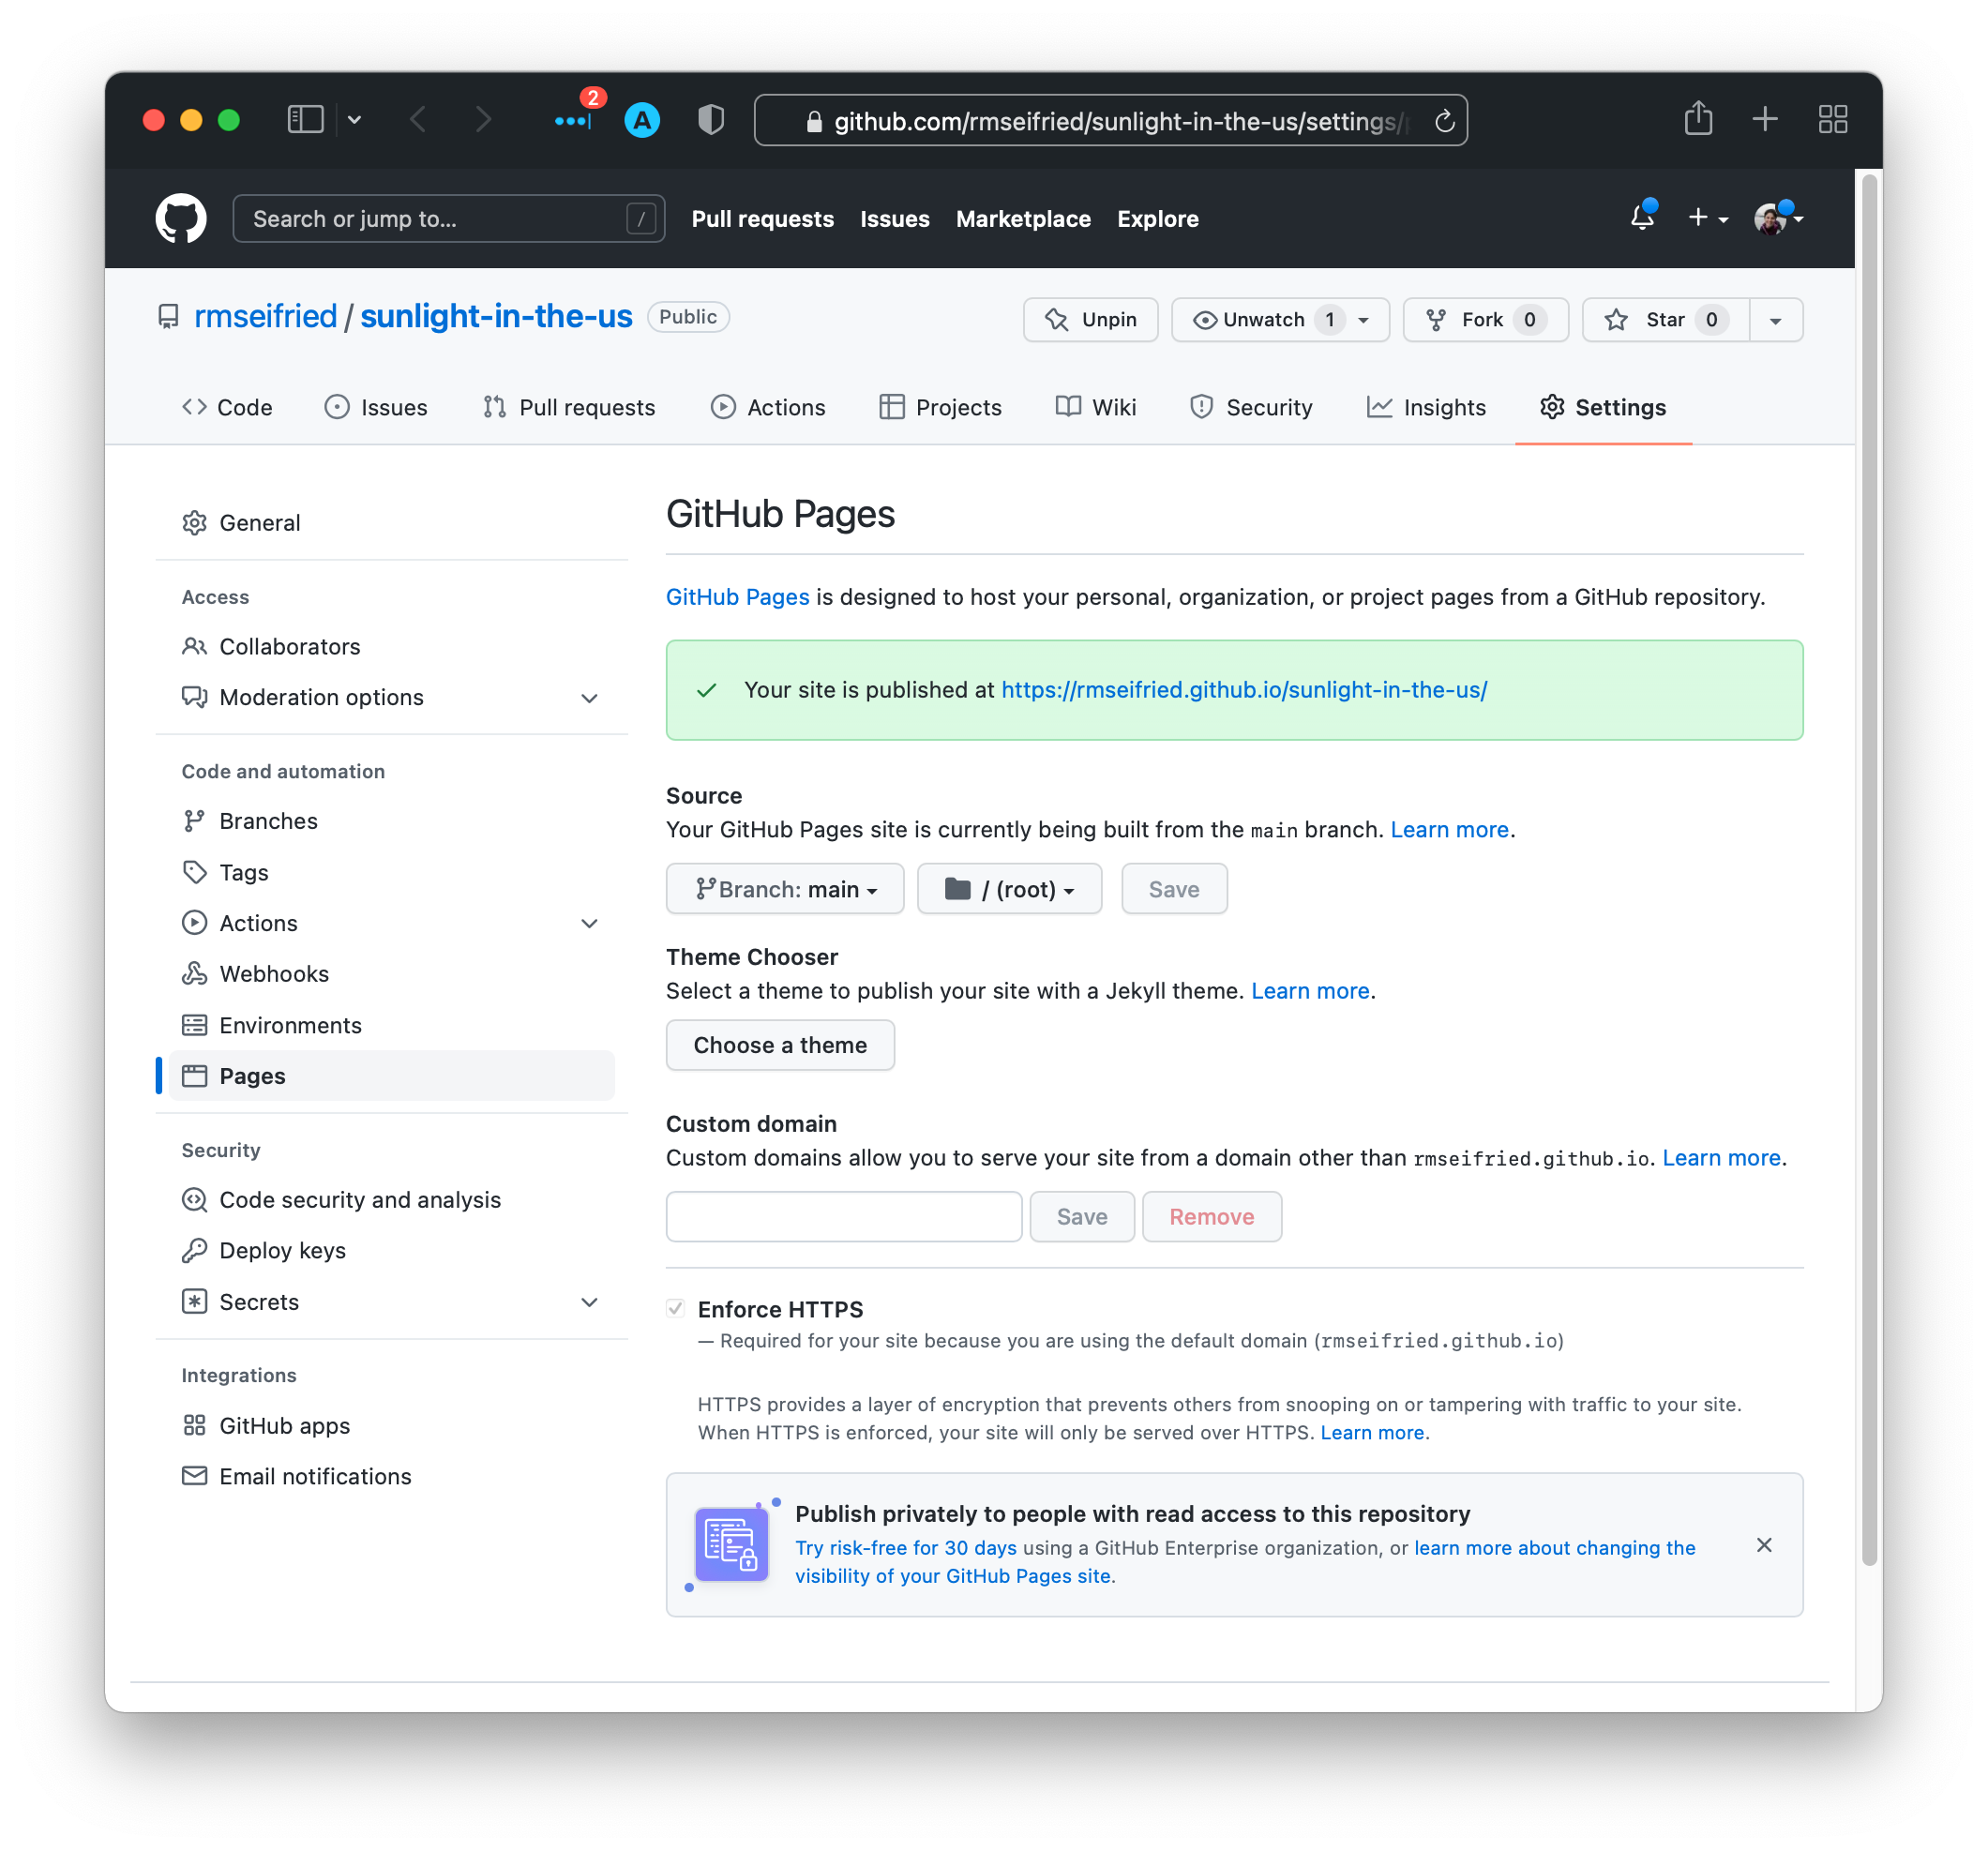
Step 7: Use GitHub Pages to generate a website from the files
- Go to
Settings, then navigate to thePagestab on the left panel. - Below “Source”, select the
mainbranch from the dropbdown menu. ClickSave.
Your web map should go live in a few minutes. Once it’s done, the Pages page should look like this:

Step 8: Revel in the web map
Congratulations! Click the URL on the GitHub Pages site and check out your web map!