Coordinate Systems
The key to how geospatial data works
Table of contents
Overview
If I told you it was 40 degrees today, what would you imagine?

How you interpret “40” depends on the system of measurement. 40 degrees means one thing if the system is Fahrenheit (super cold!) and something very different if the system is Celsius (super hot!).
Coordinate Reference System (CRS’s) function in a similar same way. We use coordinate pairs - consisting of an X value (longitude) and a Y value (latitude) - to identify a location on the earth’s surface.
The CRS is the key to understanding what those numbers mean. The same location could have thousands of different coordinate pairs - one for every CRS that exists today!
The Geoid, Ellipsoids, and Datums
These are the building blocks of different CRS’s.
Types of Coordinate Reference Systems
There are two types of CRS’s:
- Geographic CRS’s are used for 3D surfaces like globes.
- Projected CRS’s are used for flat surfaces like maps and computer screens.
![]()
Geographic CRS’s
These are used to map locations on a 3D surface. Measurements are in degrees.
Projected CRS’s
These are used to map locations on a 2D surface. Measurements are in units like meters, feet, miles, etc.
Common Projection Systems
These are the most common systems you’re likely to encounter if you work with data from the US.
Practice in QGIS
It is an excellent idea to use the same system for all the data in your project. This section will show you how to identify a data layer’s CRS and how to change it, if necessary.
Identify a layer’s CRS
The quick way to find out a layer’s CRS is to open it in QGIS and look at its information in the Properties window. These steps work for both vector and raster data.
Refer back to the Getting Started page to familiarize yourself with the QGIS interface and how to open layers.
In the Layers Panel, right-click the layer’s name and select Properties... Information about the CRS will appear in the top part of the window.
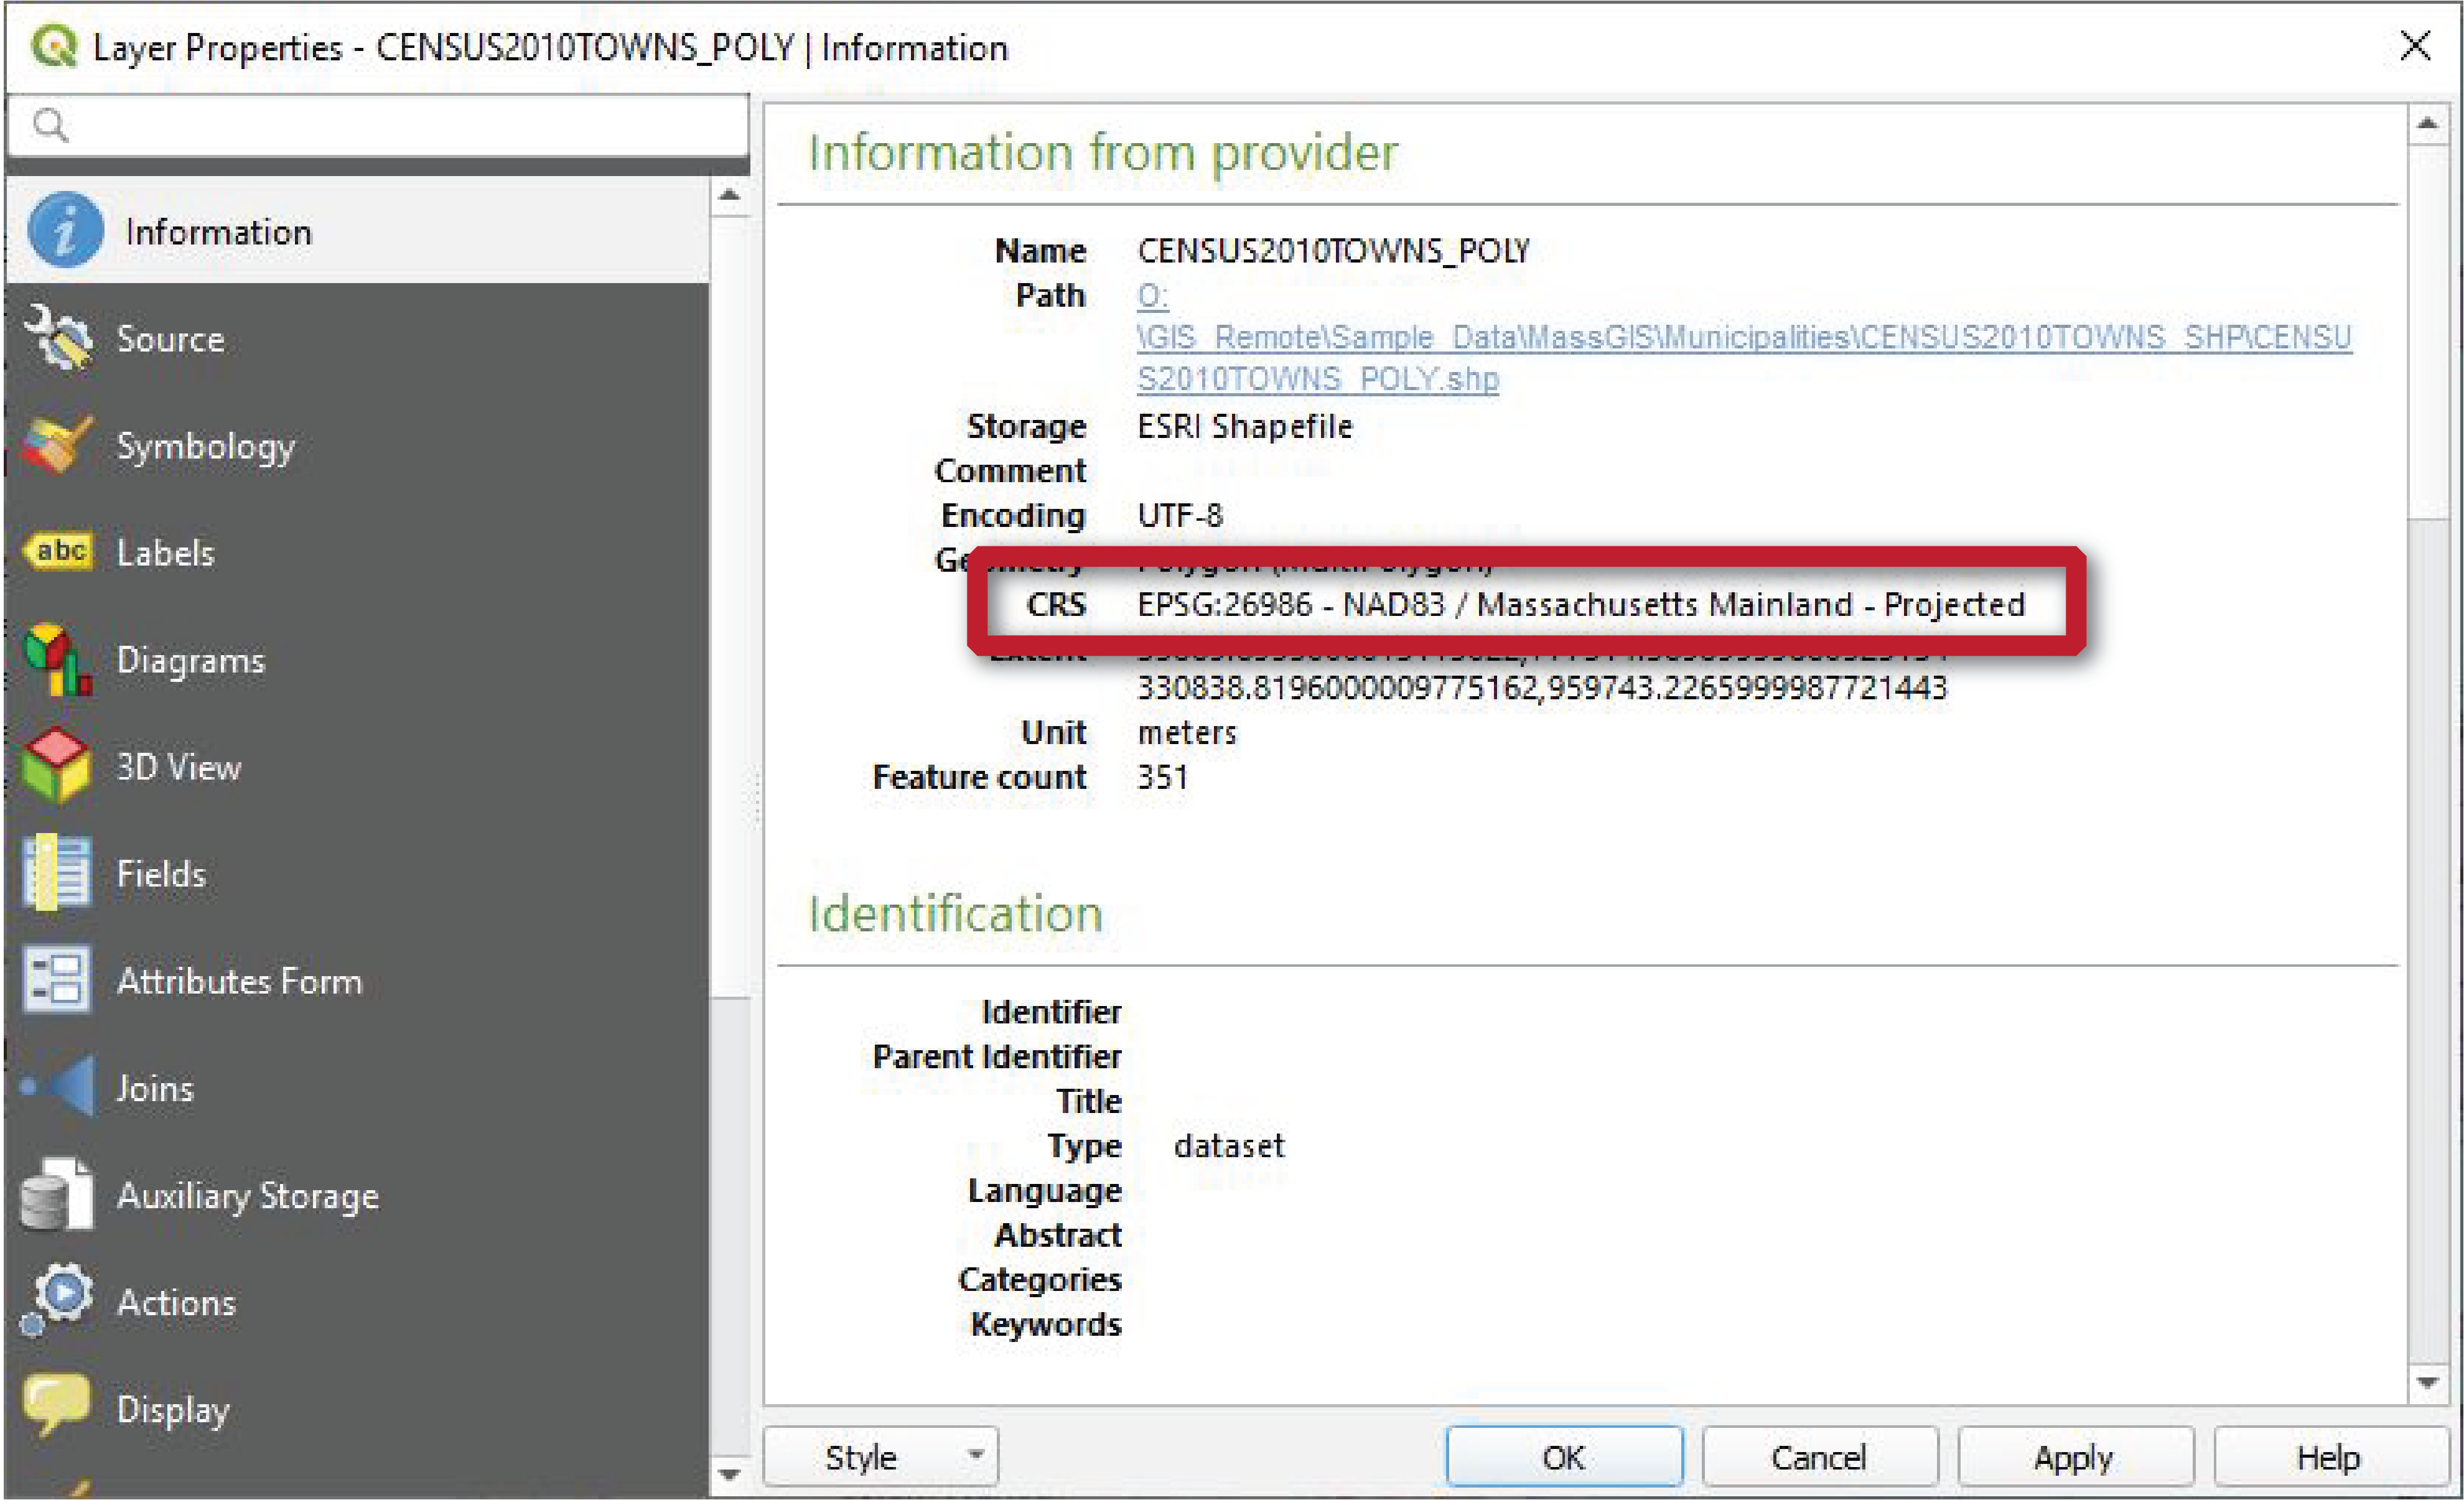
In this example, the CRS is EPSG:26986 - NAD83 / Massachusetts Mainland - Projected, which the Commonwealth of Massachusetts uses for most of its GIS data. We know this is a projected CRS because it has “projected” in the name, but also because the unit is meters. Only projected CRS’s use standard units of measurement, like feet, meters, etc.
Change a layer’s CRS
Generally, it is a great idea for all your data to have the same CRS.
Streamlining your data’s coordinate systems helps avoid issues that stem from CRS mishaps (see Troubleshooting below), and it also helps you get into the habit of double- and triple-checking that your coordinate systems are in order.
Let’s say you downloaded a data layer from the state government. You checked the layer’s Properties information and found out that its CRS is EPSG:26986 - NAD83 / Massachusetts Mainland - Projected. However, all your other data is in EPSG:32618 - WGS 84 / UTM zone 18N.
Vectors
Vectors: Export the layer
The quickest way to change the CRS of a vector layer is to make a copy by exporting it. During the export process, you have the option to define a new CRS for the new layer.
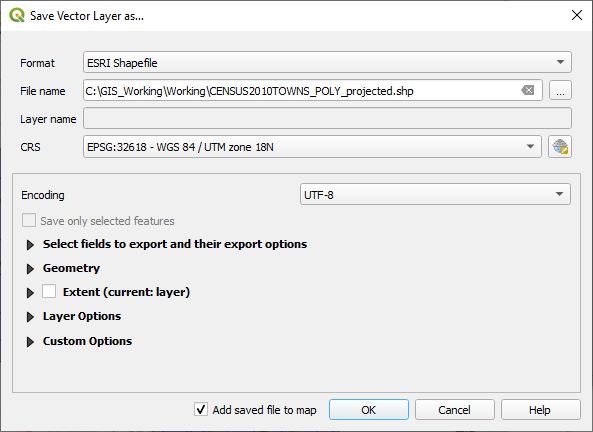
In the Layers Panel, right-click the layer’s name and click Export > Save Features As... Fill out the dialog window:
- Format: ESRI Shapefile is the default option, but you can change this if you prefer a different format
- File name: click the three dots
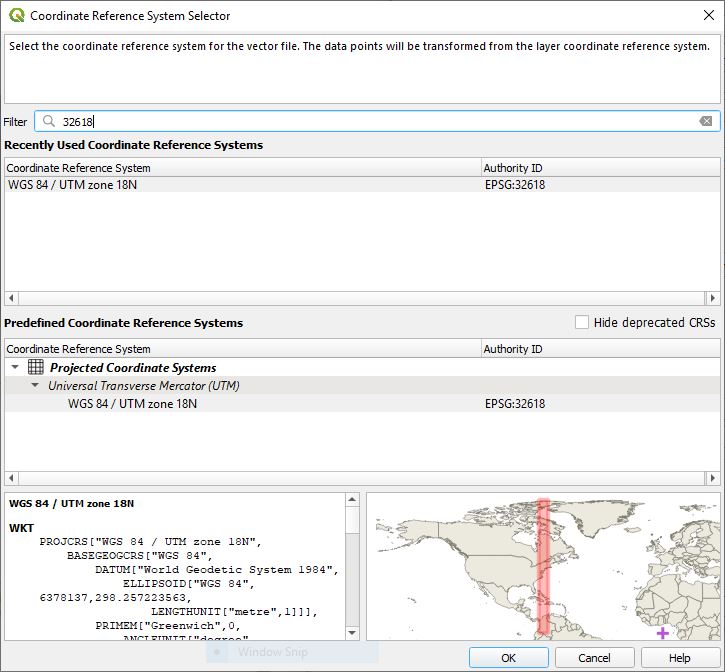
...to the right of the box, navigate to your output folder, and type in a name for the output file. Make sure to add the proper extension (.shp for shapefiles). - CRS: click the globe icon to the right of the box, then type 32618 into the filter bar in order to quickly locate the CRS you want. Select it and click
OK.
Leave the rest of the fields as their default values, and click OK.
Rasters
Rasters: Reproject the layer
While it’s possible to use the export tool to make a copy of a raster layer in a new CRS, the tool does not work well in most cases. The better option is to reproject it – a more refined process that helps ensure the accuracy of the copied data.
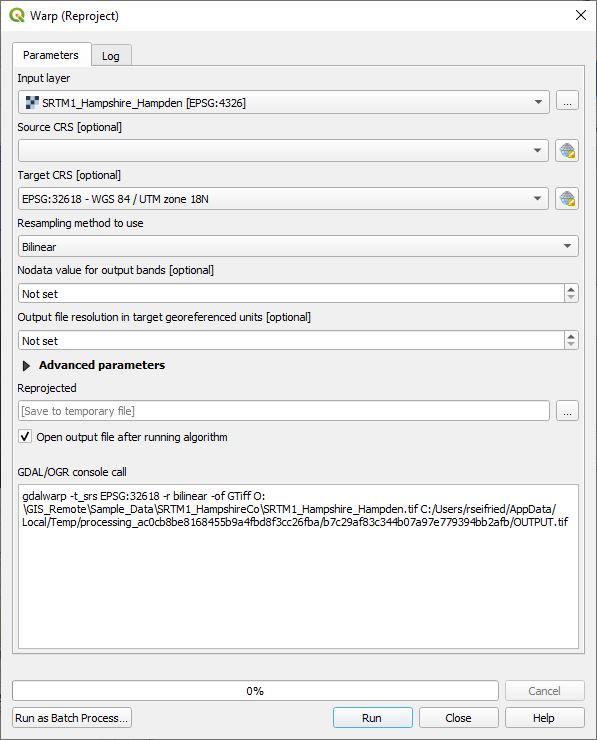
In the menu bar, click Raster > Projections > Warp (Reproject)... Fill out the dialog window:
- Input layer: select the raster layer you want to copy
- Source CRS: leave this blank - the tool will figure it out
- Target CRS: click the globe icon to the right of the box, then type 32618 into the filter bar in order to quickly locate the CRS you want. Select it and click
OK. - Resampling method to use: the specific method to choose depends on what kind of raster you are working with.
- Nearest Neighbor: if the raster has categorical data (where the pixels represent discrete values like RGB colors in a photograph) and the computer should keep the values exactly the same in the new version.
- Bilinear (faster) or cubic (more intense): if the raster has continuous data (where the values in the pixels are measurements, like rainfall data, elevations, etc.) and the computer needs to be able to blend the output values to create new ones.
Read more about raster resampling methods in this StackExchange post
By default, the tool will save the new layer to a temporary file. This is a handy way to check that everyone worked according to plan before you save a copy to your hard drive (using the export method discussed above).
Alternatively, near the bottom of the window in the Reprojected box, you can ask the tool to save the file directly to your computer. Click the three dots ... to the right of the box, navigate to your output folder, and type in a name for the output file. Make sure to add the proper extension (.tif is a good file type for rasters). When you’re all set, click Run.
Change the Project CRS
The Map View has a CRS of its own that is independent of the data layers. Gasp! What this means is that you can change the CRS for the map – thereby changing the way the data appear – without affecting the CRS of any of the data layers.
The CRS button in the lower right corner is where you can find out more about the Project CRS and change it. Click the button to open the Project CRS window.
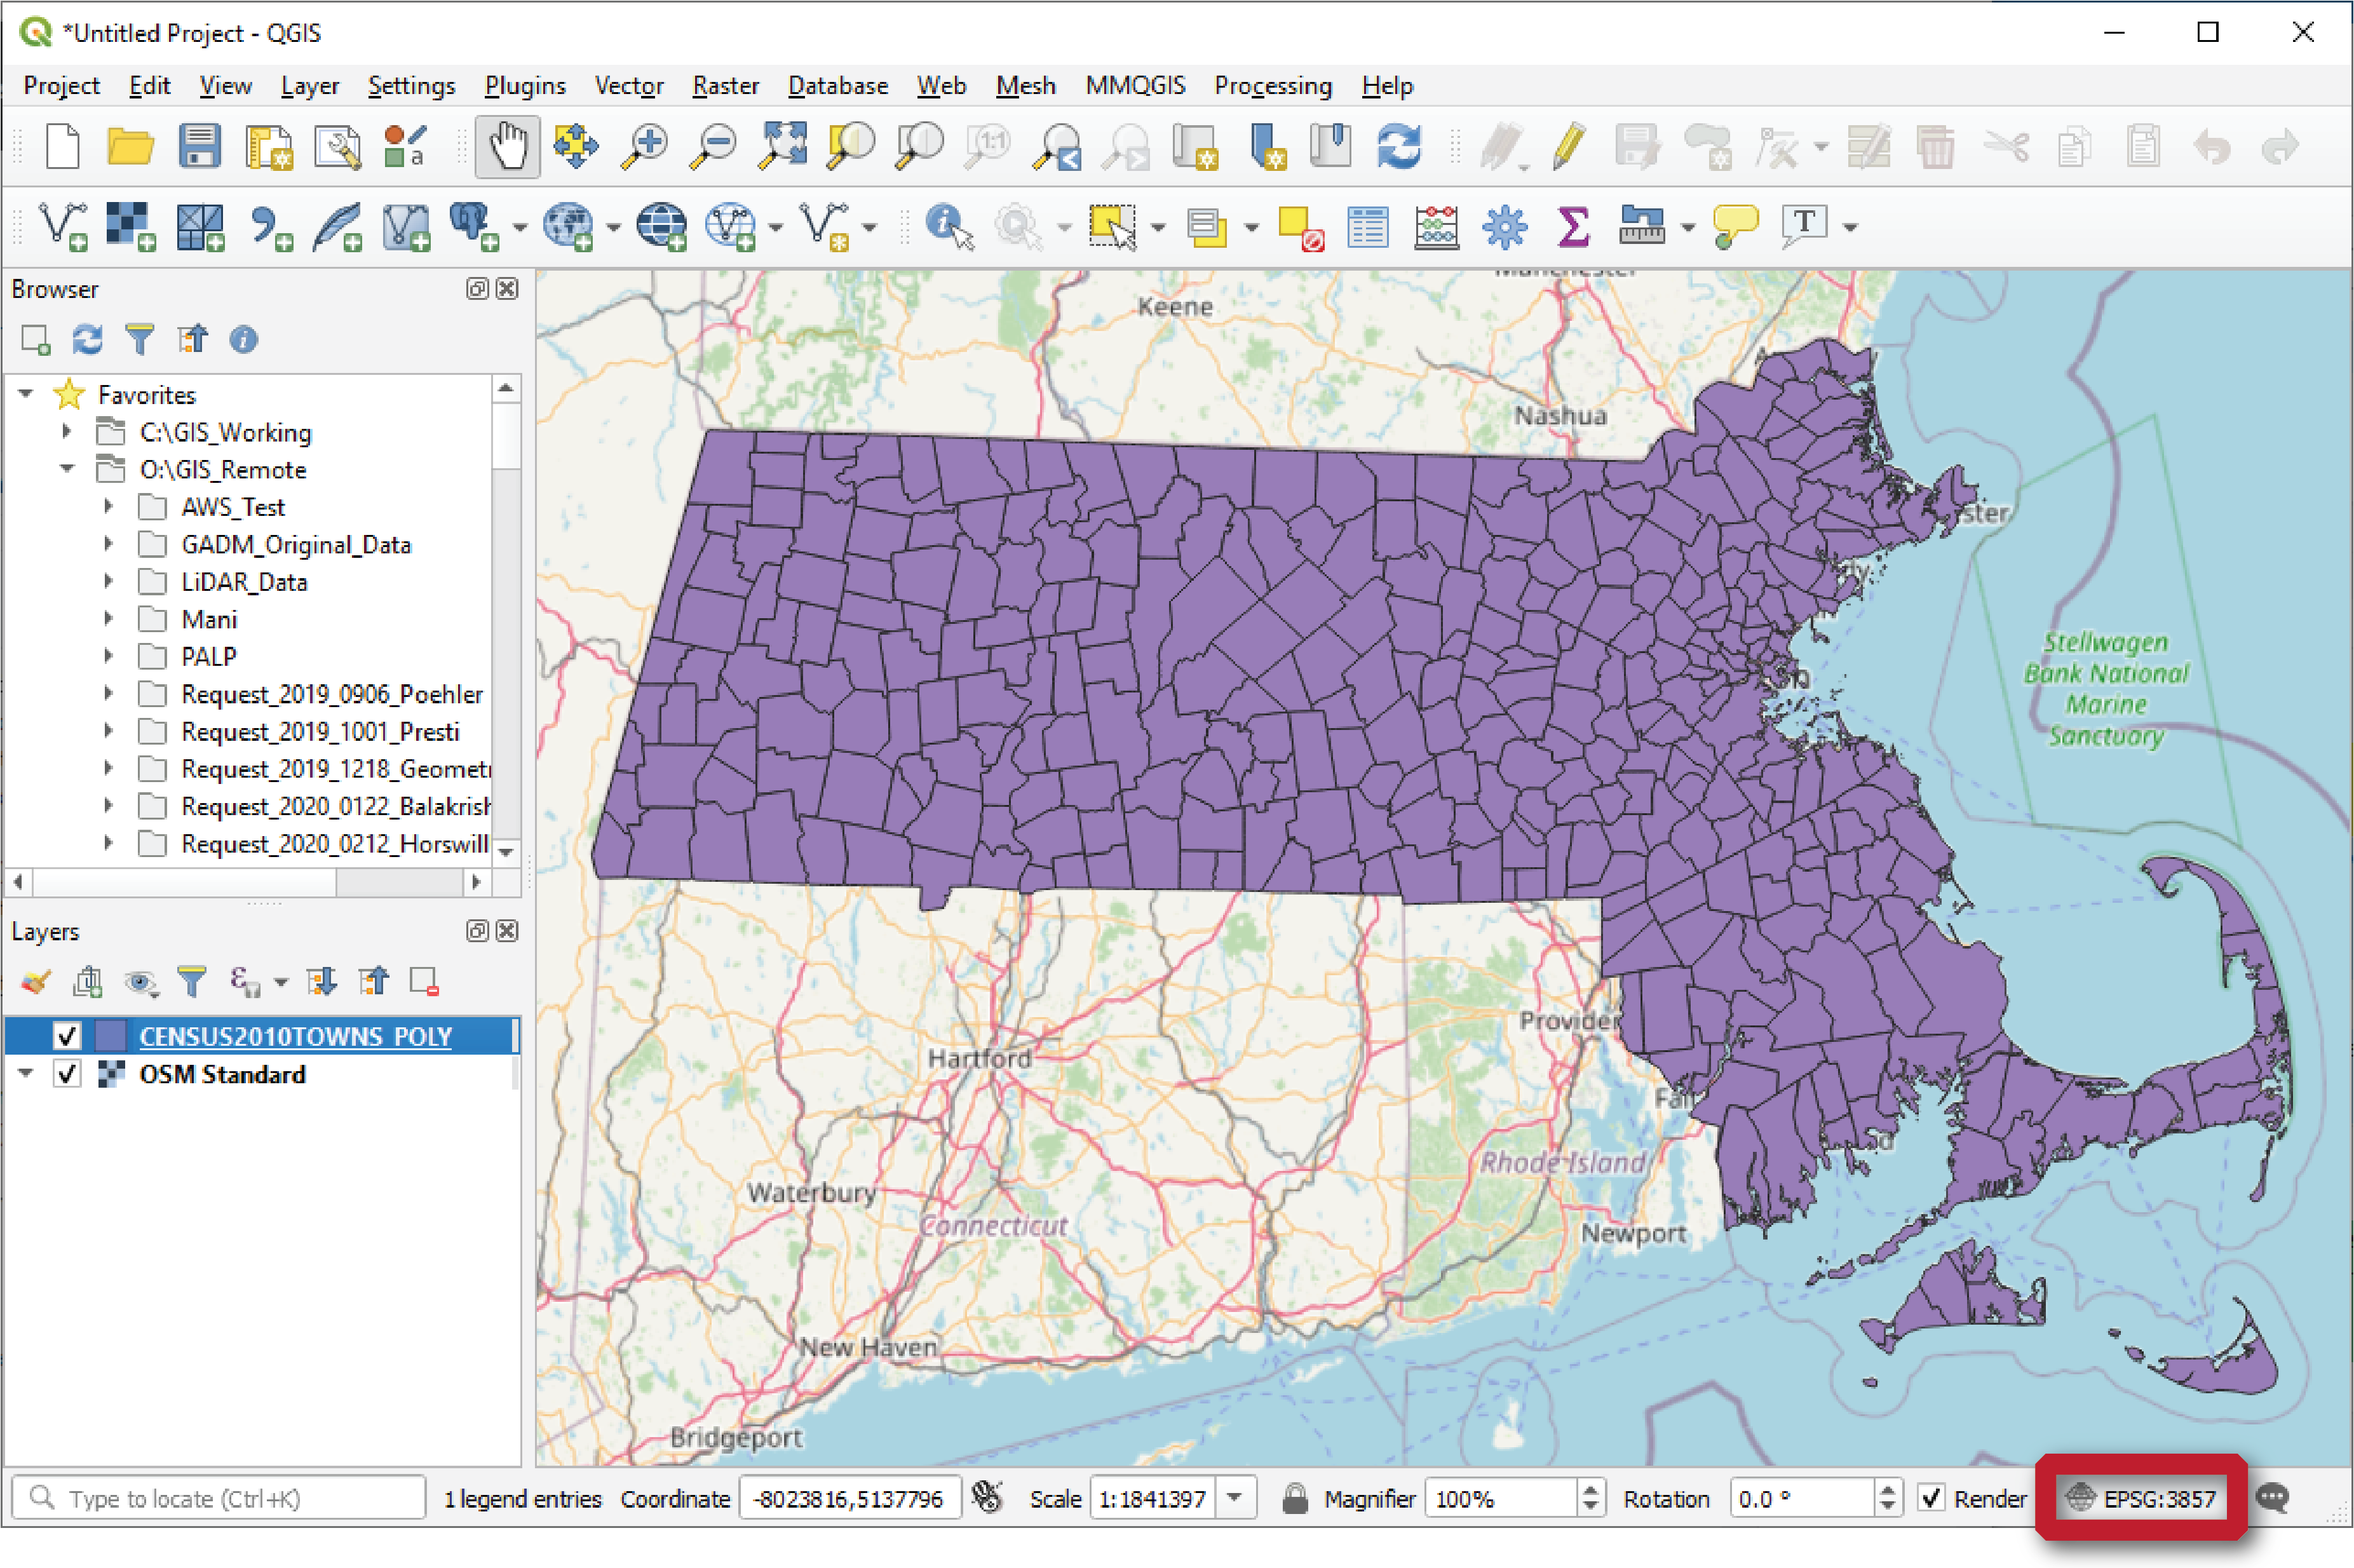
By default, the Project CRS is set to the same CRS as whatever data layer you added first. So if you know that your data layers have all different CRS’s, it’s a good idea to click this button and check to make sure your Project CRS is set to your preferred format! Again, use the Filter bar to quickly search for the CRS you want, or choose from one of the lists.
Here’s an example of why this matters for map display. This is a shapefile of towns in Massachusetts. The shapefile’s CRS is EPSG:26986 - NAD83 / Massachusetts Mainland - Projected.
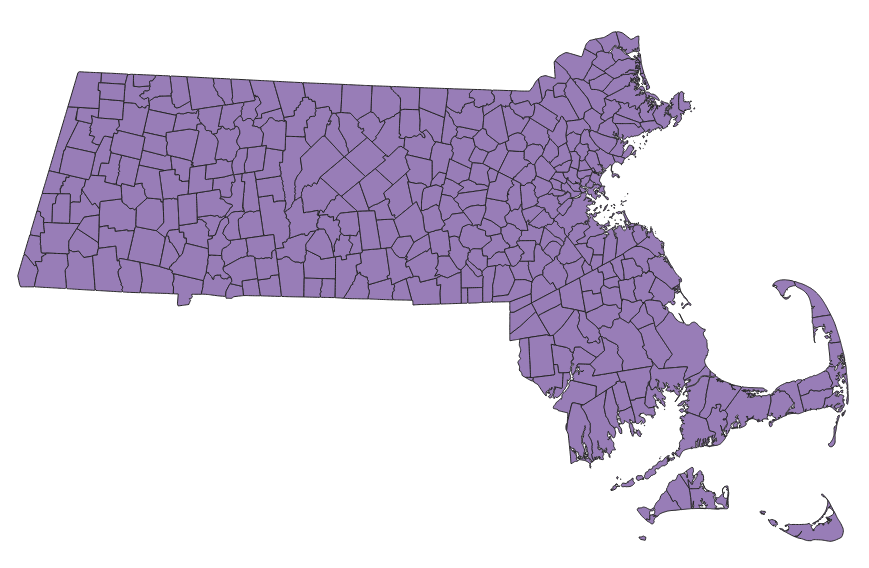
In the first image, the Project CRS is set to the same CRS. It appears “correct” – this is how Massachusetts normally shows up on maps! It looks so great because this particular CRS is a projected CRS (so it’s intended to be used for flat, 2D displays, like maps and computer screens) and because it is tailored to the location of Massachusetts.
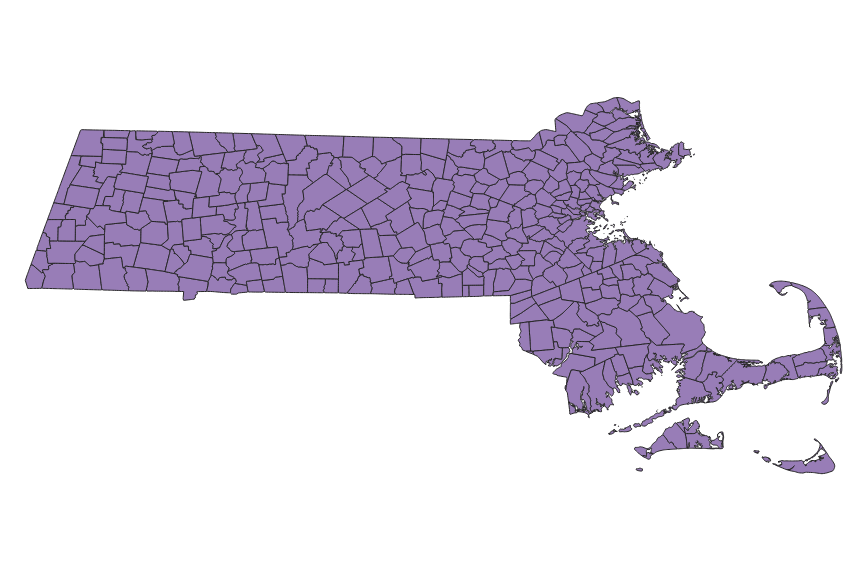
In the second image, the Project CRS is set to EPSG:4326 - WGS84. Now the state looks squished! The problem here is that the CRS is a geographic coordinate system that is intended for global mapping. It isn’t really meant to be used for making maps.
Troubleshooting
Faulty coordinate systems are very often to blame for a GIS that stops working properly.
These are some of the most common issues that pop up. If your data isn’t displaying properly, check to see if one of these could be the cause:
| Problem | Possible solution |
|---|---|
| The data layer’s CRS is wrong | Right-click, Set CRS |
| The data layer’s CRS is missing | Right-click, Set CRS or Export |
| The Map View is set to a different CRS than the data layer | Update Project CRS |
| There are multiple data layers and they all have different CRS’s | Sync those layers! |
Resources
These are some of my favorite coordinate system tools:
- EPSG.io: search for information about over 6,000 coordinate systems
- FCC DMC-to-Decimal converter: quickly convert coordinates from Degrees Minutes Seconds to Decimal Degrees (and vice versa)
- Rick King’s State Plane Coordinate System: look up the State Plane and UTM Zones for each county in the U.S.
For a fun and interactive crash-course in map projections, check out Squashing the Globe from the digital exhibit Bending Lines, by the Leventhal Map & Education Center.