GIS Basics
Map layers, data types, and organization (oh my!)
Table of contents
Overview
GIS stands for Geographic Information Systems (or Geographic Information Science, depending on who you ask). It’s a handy tool and/or approach for:
- Managing spatial data
- Analyzing patterns
- Creating maps
Chances are, you’ve already interacted with a GIS application. Here are some examples:
Map layers
The examples of GIS applications have a lot of things in common:
- They all feature a map interface that allows you to zoom in/out and pan
- They all use the map to show some kind of data
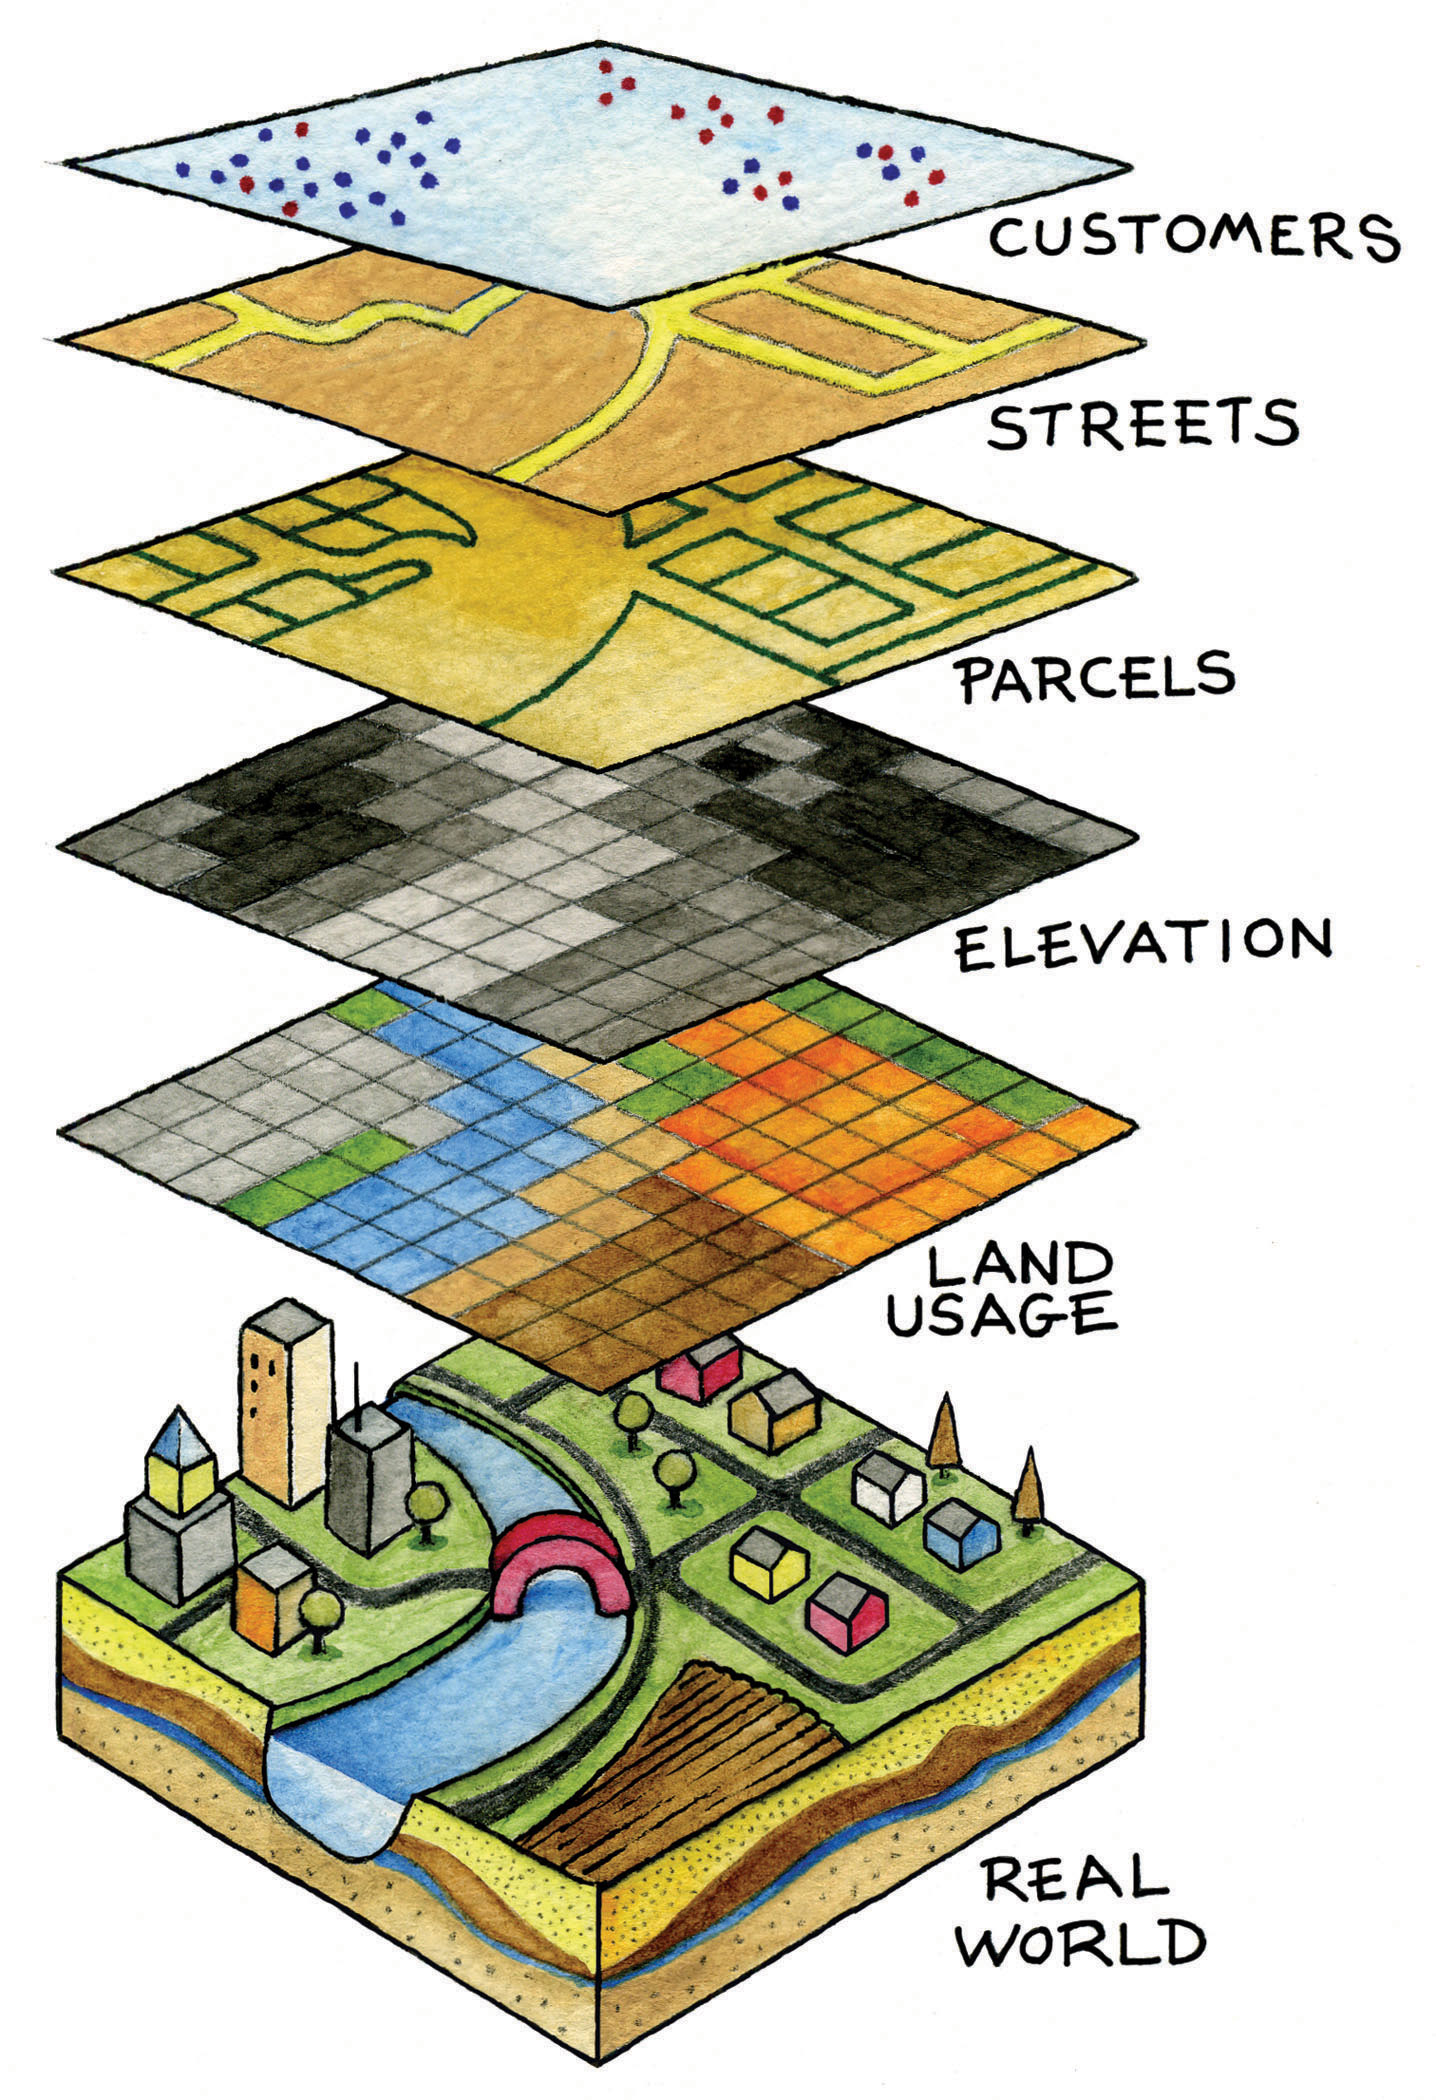
- They display the data as layers overlaying a base image
In fact, thinking about GIS as a layer cake is one of the fun visuals that “intro to GIS” courses usually start with. In a way, GIS allows us to take the real world and turn it into a collection of abstract, spatial data layers.
Data types
Let’s dive into the data that makes up the layers in a GIS: rasters and vectors.
File formats
GIS data come in many different forms - let’s take a look at some examples.
Data organization
Last but not least, we’ll look at ways to keep your data organized!
Resources
Looking for more tips and tricks related to data organization? Here are some resources to check out: